Behaviour of impedance function |Z| at different temperatures of growth soil determined by EIS-100
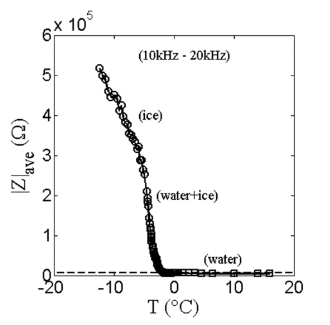
The effects of water phase changes on the |Z| level as the temperature changes when the growth medium is organic growth (cf. adjacent figure). |Z| levels are averaged over the frequency range 10kHz to 20kHz.
By comparison, the tap water level of |Z| is indicated by a dashed line and the ground level of the soil (T = +22°C) with a set of “stars”. When the temperature of the soil has fallen from -3 °C to -8 °C as described by the “diamond” character set, the |Z| level is not standardized and the water in the soil is both liquid and solid. When the temperature drops to T = -8.5°C, there is a strong increase in the |Z| levels, followed by a standardization, which is described by a set of “open squares”. The rise of response means that the water in the soil is now completely frozen, as indicated by the 90 times increase in the |Z| level when the water level marked by the dashed line is used as the reference level.
Water behaviour in carrot at different temperatures as determined by EIS-100 with impedance function
The properties of the water can be affected by the addition of salts or sugars, the composition being referred to as an electrolyte solution. Such aqueous electrolyte solutions are found, among others, in biological samples such as exemplary carrots (cf. Fig). When the temperature drops below the zero point, the liquid electrolyte suspension impedance function graph starts at -2.5 °C below steep increase, which can be interpreted as solid phase emergence in the electrolyte, slowing down the ion movement and thereby raising the |Z| level. |Z| levels are averaged over the frequency range 10kHz to 20kHz. The actual final freezing occurs at a temperature below -9 °C, whereby |Z| stabilizes at a level approximately 70 times greater than the |Z| level of the water marked by dashed lines.


